Zine Genres, by Lustrum
The final assignment for my Data Visualization Class at the CUNY Graduate Center, taught by Erin Daugherty and Michelle McSweeney was to articulate a research question, find data for it, and visualize it in three different ways.
The Data: Background
I chose to work with data about the Barnard Zine Library, which I founded in 2003 and continue to curate. I am frequently asked how zines have changed over time. Since I catalog zines as they are acquired, and not by decade (or lustrum, which is what a five-year period is called, and the unit of measure I have chosen for this project), I have don’t have the clearest sense of how zine genres and contents have shifted. I have theories, which I will test here.
By comparing the percentage of zine genres in the Barnard Zine Library, correlated to the five-year the zines were published, I hope to illustrate the emphases of each era.
The Research Question
My suspicion is that zine creators in the 1990s wrote more about sexual assault and critiqued capitalist systems of oppression more than their 2010s counterparts, who are more likely to write about mental health and friendship, and turn to more artistic expressions of their times. For a little background, from the Zine Librarians Code of Ethics, zines are
beautifully and wonderfully varied, is often weird, ephemeral, magical, dangerous, and emotional
These singular works are not widely held in libraries, and when they are, their often inadequate descriptions in library catalogs further diminishes their visibility in the places entrusted to document cultures and movements. Zines are first person stories, written for peer audiences that capture experiences and viewpoints otherwise underrepresented in mainstream libraries, archives, and museums. Endeavors like this one attempt to help lift the voices of people holding marginalized identities because of their age, race, ethnicity, gender, gender identity, disability status, income, education, and/or their political opinions.
The Audience
I frequently get asked about how zines have changed over the years–by journalists, undergraduates, senior scholars, zine makers, librarians, and audience members at panels. How zines have changed over the years could be of interest to people doing work with girls and women’s studies, gender studies, creative nonfiction, media studies, cultural studies, punk history, social justice, sociology, psychology, history of the book, English, library and information studies, and in other disciplines, as they imagine. Maybe it will be appealing to data scientists, too.
Zine Genres
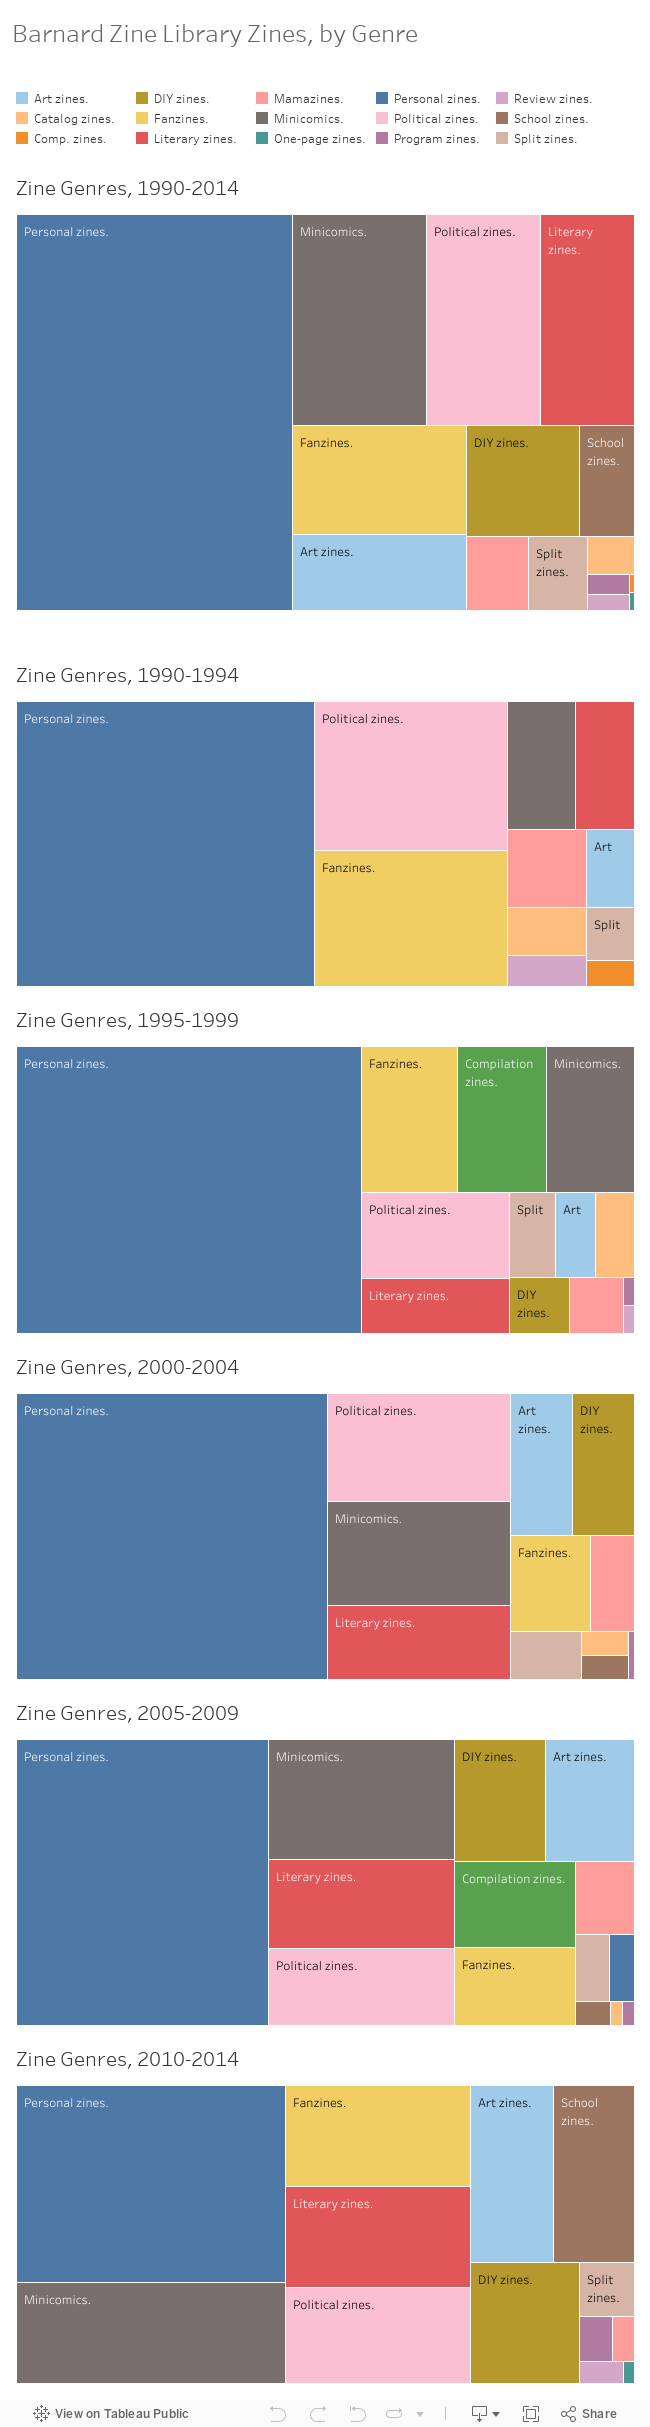
My first visualizations is a tree plot and sub plots, that show the moving collection percentages of fifteen zine genres employed at the Barnard Zine Library:
- 24-hour Zines: zines conceived, created, and assembled in a 24-hour period
- Art Zines: zines comprised primarily of art work
- Catalog Zines: zines that sell things, often other zines
- Compilation Zines: zines edited by one or more people, comprised of contributed content, often related to a theme
- DIY Zines: (DIY stands for “Do It Yourself”) zines that intend to educate the reader on how to do or make something. This category includes, but is not limited tok cooking, or “cookzines.”
- Fanzines: zines about a person, thing, or activity, often music
- Mamazines: zines about parenting, written by a person of any gender (this genre name should probably change!)
- Minicomics: zines comprised primarily of comics and cartoonlike images. They are generally smaller than comics, and more autobiographical
- One-page Folding-Zines: zines made out of one sheet of paper, folded in eight, with a slit in the middle to make it fold into a book
- Personal Zines: zines on personal topics, autobiographical creative nonfiction
- Political Zines: explicitly political, sometimes action-oriented zines
- Review Zines: zines that review other zines and sometimes books, music, and comics, as well
- School Zines: any zine made for a class, grade, organization, or otherwise not 100% under the creator’s impetus and control
- Split Zines: most often a zine with a tête-bêche or dos-a-dos binding, where one contributor’s content is head-to-toe and front-to-back with the other contributors
The Data: Visualized
Treemap
If the embed link isn’t functioning in your browser, here’s a link to the visualization on Tableau Public.
Data Decisions
In my past visualizations I’ve used Tableau’s color blind palette, but since it only has 10 colors, and my treemap has 15, I went with Tableau 20. I was concerned I wouldn’t finish all three plots and the blog post in time, so I let that go, to be revisited before Thursday.
The top treemap shows zines, ranked by genre percentage over the whole 25-year period, with each genre assigned its own color. The exercise is repeated five times, once for each lustrum. Overall, personal zines comprise 44.33% of zine genre types and is the top-ranked genre throughout each lustrum, as well. This shows that zines held in the Barnard Library, a collection of zines predominantly made by women, are heavily focused on personal experiences. Political zines remain in the top five categories until the 2010-2014 lustrum, which bears out my theory that zines are less political now than they were in earlier years. Art zines are more heavily represented in each lustrum, giving credence to the other part of my hypothesis.
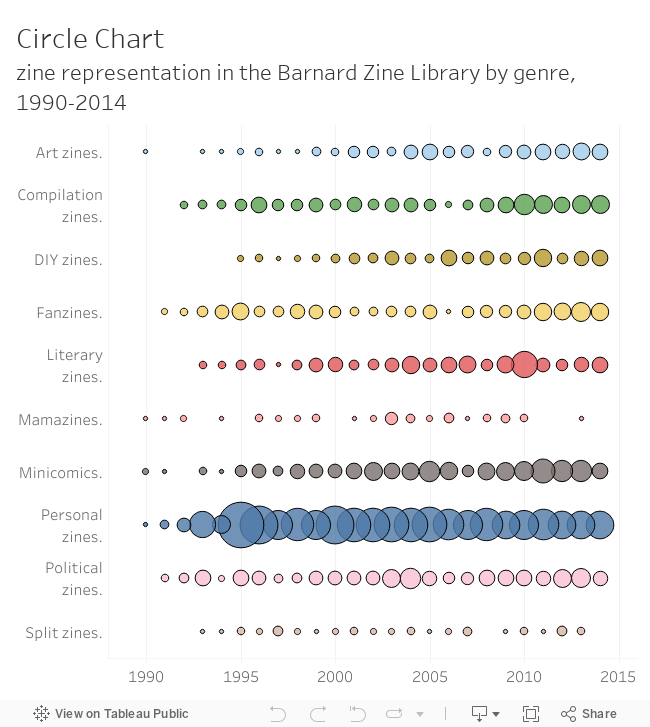
Circle Chart
If the embed link isn’t functioning in your browser, here’s a link to the visualization on Tableau Public.
Data Decisions
I originally wanted a dispersion chart here, mostly because I think they look cool, but it turns out, I don’t have sufficiently constrained enough publishing dates to make such a visualization possible. Instead, I chose sized circles to contrast zine genre change by lustrum.
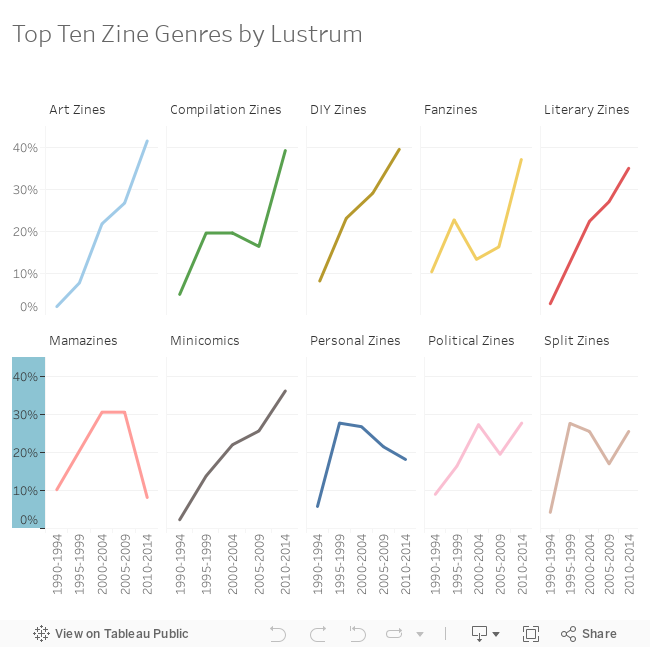
Line Graph
If the embed link isn’t functioning in your browser, here’s a link to the visualization on Tableau Public.
Data Decisions
Moving on from the treemap, I wanted to get a better look at zines by genre, so I chose to make one line graph of the top five zine genres over time and small multiples to illustrate the top ten individually. I don’t know what happened with the missing lustra heading on Literary and Split Zines, so I’ll figure that out for the final presentation. Another fix I need to make: the colors changed because I started a new workbook.
The small multiples give a good snapshot of how each genre’s representation in the Barnard Zine Library changed over time.
Next Steps
Clearly I need to make the small and medium-size fixes I have mentioned throughout this post. A large change would be to add holdings from zines from other collections to be able to compare and them by library type and focus. How do genres compare in a library that has more gender diversity? Or one with holdings that go back farther?
I had originally intended to compare Library of Congress Subject Headings (LCSH), rather than genres, but the volume of headings and the data clean-up involved were too cumbersome for this project. I need to make a lot of decisions about LCSH taxonomy and experiment with concatenation and cell-splitting to see how best to manage this massive dataset.
Further Reading
For more about my process and choices, see my proposal and notes.
I didn’t do as much tweeting this week, but do check out threads from Saturday and Sunday.
Also, big shout outs to Digital Fellow Hannah for kindness and talking-me-downness and librarian zinester Rhonda, without whom I’d still be struggling to transform my dataset.